Beat the MTurkers: Automatic Image Labeling from Weak 3D Supervision
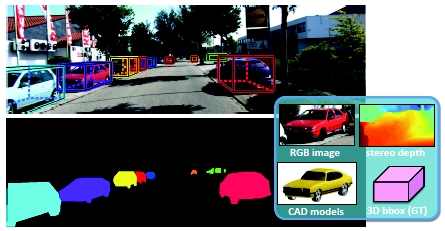
In this paper, we show how to exploit 3D information to automatically generate very accurate object segmentations given annotated 3D bounding boxes. We formulate the problem as the one of inference in a binary Markov random field which exploits appearance models, stereo and/or noisy point clouds, a repository of 3D CAD models as well as topological constraints. We demonstrate the effectiveness of our approach in the context of autonomous driving, and show that we can segment cars with the accuracy of 86% intersection-over-union, performing as well as highly recommended MTurkers!
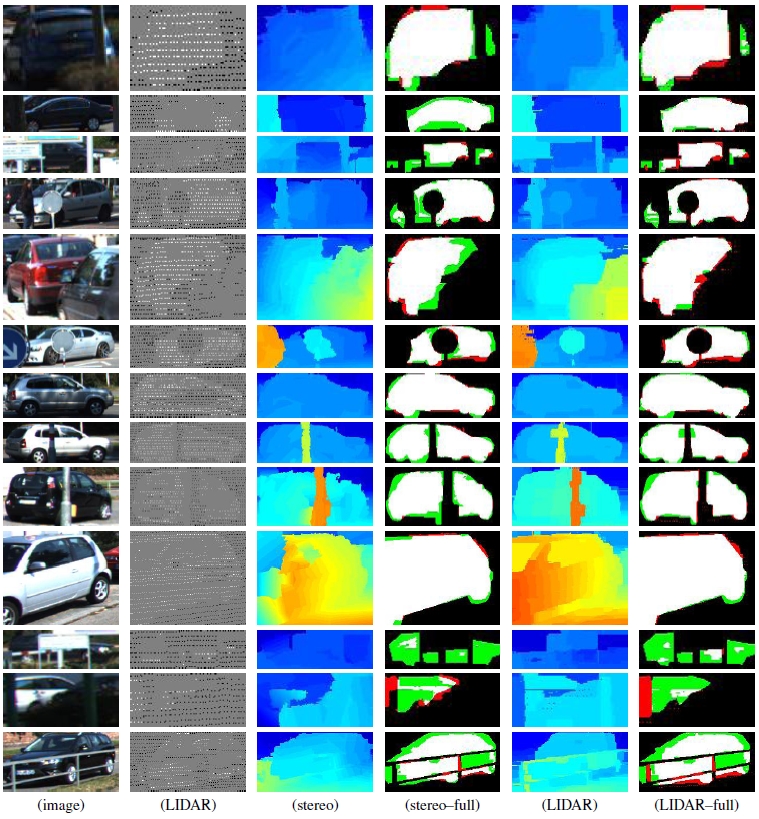
Below are some examples from the dataset and also our segmentation results. In the figure, each row shows the image, LIDAR points (White: car, Black: bckgr.), stereo depth, results of our full model with stereo (White: True Positive, Black: True Negative, Red: False Positive, Green: False Negative), depth images reconstructed by Laplacian MRF, and results of our full model with LIDAR. Last three rows show our failure modes.
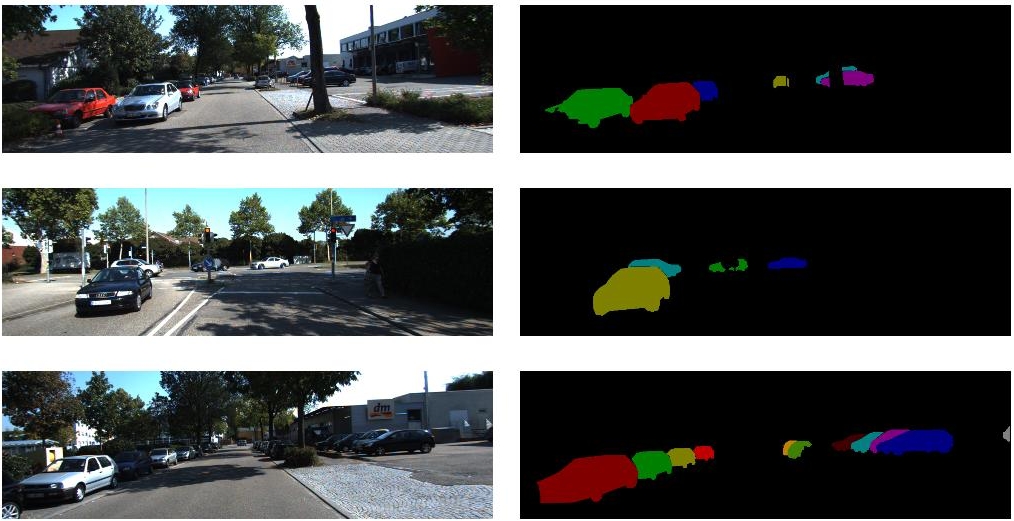
We also provide the 301 instance-wise segmentation ground truth (annotated by our in-house annotators). Those 301 images are randomly selected from the KITTI detection benchmark. Some examples are shown below. At the download link (3) below, you can also find the results generated by our proposed method on the FULL KITTI detection benchmark, which is reproduced by Ziyu Zhang .
Download
Dataset and code
(1) Dataset and codes used for the experiments in the paper can be downloaded from here.
(2) 301 instance-wise segmentation annotated by our in-house annotators can be downloaded from here.
(3) Instance-wise segmentation results on the FULL KITTI detection benchmark, which are generated by our method, can be downloaded from here (Thank Ziyu Zhang for generating it).
Statistics
We selected a random subset of images from the KITTI dataset, having a total of 950 cars. We asked 9 in-house annotators to provide very high-quality segmentations. It took on average 60 seconds to label each car, and 16h to label the full dataset, where each image is labeled by a single annotator.
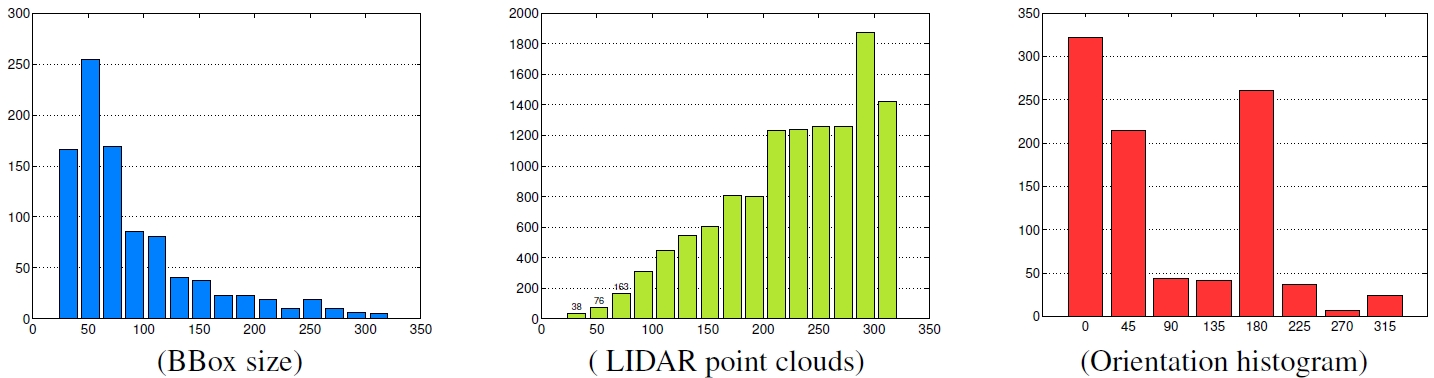
In the figure, we show the dataset statistics: (Left) Histogram of car scales in terms of bounding box size, defined as the square root of the bounding box area. (Center) Average number of LIDAR points for different scales. (Right) Histogram of car orientations.
Citation
If you use our code or dataset, please consider citing our CVPR 2014 paper:
-
"Beat the MTurkers: Automatic Image Labeling from Weak 3D Supervision"
Liang-Chieh Chen, Sanja Fidler, Alan L. Yuille, and Raquel Urtasun
IEEE Conference on Computer Vision and Pattern Recognition (CVPR), 2014
If you use the results generated by our method on FULL KITTI detection benchmark, please also consider citing Ziyu's arxiv preprint (accepted to appear at ICCV 2015):
-
"Monocular Object Instance Segmentation and Depth Ordering with CNNs"
Ziyu Zhang, Alexander G. Schwing, Sanja Fidler, and Raquel Urtasun
preprint arxiv: 1505.03159
Acknowledgements
The first author was partly supported by ARO 62250-CS and ONR N000014-10-1-0933. The authors thank Kaustav Kundu,Wenjie Luo, Chen Kong, Zhou Ren, Jia Xu, Meng Ye, and Edgar Simo-Serra for helping us with annotation. Besides, the authors thank Ziyu for running the method on full KITTI detection benchmark.